[NEW: ACP Exam Prep Book Available - "I Want To Be An ACP" (Link)]
An oft repeated management quote goes like this:
“Planning is indispensable, but plans are useless.”
Whether you like it or not, planning is essential. Without planning, there’s no horizon to look at and no way to know at what point in time deliverables will be given. However, anyone can tell you this: It rarely happens that the plan will be spot-on accurate. You don’t need a project manager to tell you that!
Planning leads to estimation of items or tasks to be executed in a project. Unfortunately, an enormous amount of time is spent in estimating — meticulously breaking down the deliverables to packages, then to tasks, finding dependencies and checking if anything at all is missed. Ironically, the name is “Estimate.” It means that these items aren’t cast in stone, and they need not be accurate. Also, as the name suggests, an estimate is not a commitment; it can change.
The Project Management Institute® (PMI), the leading standard body on project management, explains that there will be variations in estimates at different stages of a project, as shown in the diagram below. Typically, this type of “tornado diagram” is generally used in risk sensitivity analysis. However, I have taken the liberty of using it in estimation. After all, estimation itself is fraught with inherent risks.
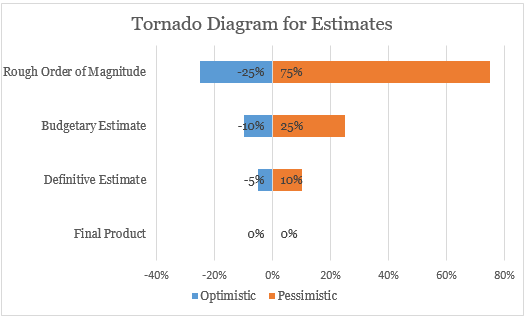
PMI’s PMBOK Guide 5th Edition tells that a “rough order of magnitude” (ROM) estimate is applicable during the initial stages of the project. Here the range runs from -25 percent (optimistic) to 75 percent (pessimistic). For example, an estimation of 10 weeks will vary from 7.5 weeks to 17.5 weeks. As the project progresses, the range gets narrower as in Budgetary Estimate (-10 percent to 25 percent). In the later stage of the project the range becomes definitive; the variation runs from -5 percent to 10 percent. I have put the final range as zero percent when the final product is delivered. Only at that point in the project will the estimate and actual value match!
Another estimation technique considered by PMI — Program Evaluation and Review Technique or PERT — says there can be three types of estimates: pessimistic, optimistic, and most likely. To derive a final estimate, you have to take an average or weighted average.
You may well ask, if estimates aren’t concrete and significant variations arise in different stages of a project, then why estimate at all? Estimation helps in certain areas:
- To set goals;
- For decision making by considering trade-offs; and
- To communicate with stakeholder, both internal and external.
So estimation is useful and needed. But why spend countless hours on it, when we know it’s likely to change? Well, granted that in fully plan-driven approaches, you need to have complete end-to-end plan and hence, a detailed estimate. But how about business areas where requirement churns are high? Doing a detailed, time-consuming estimation exercise in such cases won’t be a judicious use of time.
Therefore, I advise going for relative estimation.
Relative Estimation
Relative estimation is based on the principle of comparison. Let’s look at some examples.
You’re shopping for clothes. Do you ask for a shirt with a shoulder length of 110 cm and 55 mm, or do you simply ask for a shirt with small (S), medium (M) or large (L) measurement? You’re most likely to choose by checking the relative measurement and, of course, briefly checking whether it will fit you. That’s a relative estimate, first looking at your own shoulder size, then the shirts available and then choosing which one is most likely to fit.
When you’re having lunch in a restaurant, do you order 200 grams of rice, 100 grams of dal, 10 mg of salt and 10 mg of sugar? Quite unlikely. Rather, you seek out a small meal, a mid-sized one or a super-sized serving. Or you may ask the waiter what size a given dish is. The waiter might signal with his or her hands to help you decide which one will be right for your appetite. That’s also using relative estimation. (Thanks to Mike Cohn’s Agile Estimating and Planning for this explanation.)
You’re buying fruit at a stand. You see a variety of choices, smaller to bigger sizes, from lesser to more ripened, from fresh to not-so-fresh. Do you ask for mangoes that are 40 percent ripe or 110 grams in weight or 90 percent fresh? Unlikely. Rather you compare or you may ask the vendor a few questions and take a judgement call. Again, that’s relative estimation.
Now, let’s extend that to agile development, using another example with fruit.
Understanding Agile Estimation with “Fruit Points”
Imagine you have a special event at your home and you want to make a fruit salad. You have a big accumulation of fruit in front of you — grapes, apples, watermelons, bananas and mangoes. You want to estimate how long it will take to cut and dress them.

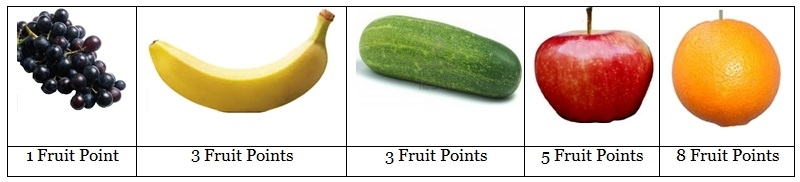
Let’s take a grape first and assign it one “fruit point.” Why one point and not 10? It’s just arbitrary. You can very much choose another measure — 10 points or 50 points or even 100 points. The idea here is to measure the relative time of cutting and dressing one fruit with respect to another.
While cutting, there are certain uncertainties involved, such as the sharpness of the knife, size of the fruit and cutting difficulty. Keeping those in mind, we have to find out how long it will take to cut these fruits: grapes, apples, oranges, bananas, pineapples, coconuts, pears, mangos, cucumbers and watermelons.
If dressing a grape is one fruit point, then dressing for a banana will be around three points because you have to peel the skin before you can cut it. An apple will be around five fruit points because you have to clear both ends, peel off the skin, cut it, and also remove the seeds. For a cucumber (botanically a fruit!), it will take more time than a grape, but less than an apple and will be in the range of a banana. Of course, if you have a big one and you want to peel-off its skin, you can assign five or even eight fruit points.
This simple example tells you how quickly you can relatively estimate for the cutting of the fruits. Now, let’s say that the fruit basket has multiples of most of the fruits. How long will it take to prepare them? Let’s look.
Timeboxed Iteration and Velocity
Let’s run a small test. We have five minutes and in those five minutes we need to figure out many apples we can cut and dress up for the fruit salad. This five minute test is our “iteration duration.” And this iteration is “timeboxed.” It ends in five minutes on dot with no extra time permitted.
After running through the iteration, we have found that we can cut two apples. Because each apple is five fruit points, that equals 10 fruit points in total. This becomes our “velocity.” In other words, our velocity for one iteration is 10 fruit points or simply 10 points.
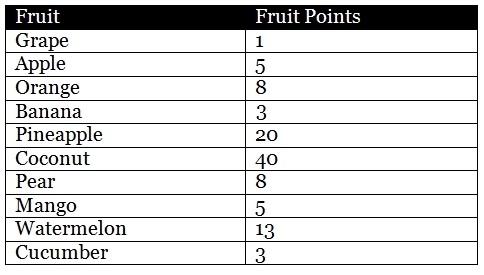
Now consider that the fruit basket has 20 grapes, two apples, three oranges, two bananas, one watermelon, two pears, and one pineapple. How long will it take to get through all of that fruit? The answer is simple. We have to get the total amount of work by adding up the relative estimates of the fruits:
20 * 1 (grapes) + 2 * 5 (apples) + 3 * 8 (oranges) + 2 * 3 (bananas) + 1 * 13 (watermelon) + 2 * 8 (pears) + 1 * 20 (pineapple)
= 20 + 10 + 24 + 6 + 13 + 16 + 20
= 109 fruit points
Let’s round up to a total of 120 fruit points, to take into account extras, such as washing the knife between fruits and removing the skins to clear the cutting areas. And sometimes you may just want to relax your fingers a bit.
We know our velocity is 10 fruits points, which is of five minutes’ duration. Hence, our rough estimate to dress all the fruits in the basket will be 12 iterations.
Total = 120 fruit points
Each iteration = 10 fruit points
Total number of iterations = 120 / 10 = 12
We’ll have 12 iterations totaling 60 minutes or one hour. So, it will take one hour to prepare the fruit salad. Was not that quick to figure out?
Story Points, Iteration and Velocity in Agile Development
The fruit salad example lays out how estimation can be derived quickly. Similar concepts can be applied in agile development. In agile approaches, we have a “product backlog,” a live document containing all the requirements. Each item in this backlog is called a “product backlog item” (PBI). We can determine the effort required to complete a PBI by considering various factors such as complexity, risk and effort.
One interesting point to note here is that we don’t need a detailed product requirement specification or workflow diagrams or detailed design to estimate the effort needed for a PBI. All we need to know is how complex one PBI is compared to another item or how risky one item is compared to another item or what a combination of a few parameters will look like.
When we estimate the PBIs, we estimate the PBIs in “story points.” Like the fruit points of our example, story points also consider relative estimation — in other words, a comparative measurement. Story points are estimation of size or complexity or difficulty in a relative way. After estimation of PBI in terms of story points at the product backlog level, they’re taken up in iterations, broken down further into tasks and executed within a timebox.
You might be wondering how I arrived at the scale of 1, 3, 5, 8, 13, etc. — my “estimation scale,” — while calculating the fruit points. I’ve simply used the Fibonacci series here, whose sequence goes like this: 0, 1, 1, 2, 3, 5, 8, 13, 21, 34, 55… I’ve modified mine a bit to remove the illusion of precision (changing 21 to 20 and 34 to 40, for example).
Why the Fibonacci series? Because it reflects the idea that a greater amount of uncertainty exists as requirements gets larger. In plainer terms, you can say non-linear scale is used for estimation in story points. Other non-linear scales in use include t-shirt sizing (small, medium, large, extra-large and so on) and doubles or the power of two series (1, 2, 4, 8, 16 and so on).
Note that one fruit point or one story point doesn’t translate to a time value such as one minute or one hour. Also note that your estimation may vary when compared with another person’s or another team’s estimation. So remember:
- Story points are relative estimates of size, complexity or risks;
- Story points aren’t comparable; and
- Estimating in story points is faster and minimizes waste.
Velocity in agile development is the sum of story points completed in an iteration. If a feature (a PBI) isn’t complete, it won’t be considered for velocity calculation. Why? In our fruit salad example, would you put a half-cut apple in the salad and present it to your guests? Definitely not. Similarly, in agile development, if the feature isn’t complete, it doesn’t add any value to our customer. Hence, we don’t consider that feature’s estimate in story points in our velocity calculation.
For velocity remember these points:
- Velocity is the sum of story points completed in iteration;
- If the feature isn’t complete, then it won’t count towards the velocity;
- Velocity can change over the iterations; and
- Velocities among different teams aren’t comparable.
These concepts are used in PMI’s specific certification on agile, the Agile Certified Practitioner (PMI-ACP), and also in PMP with respect to the scope management knowledge area. More importantly, if you’re working in agile development projects, then understanding story points, story point-based estimation, estimation scale and velocity are not only essential but foundational.
This article was first published by MPUG on 10th May, 2016.
You may also like:
- My Experience – PMI ACP Examination
- 30 PMI-ACP Free Questions with Answers (Part - 1 and Part - 2)
- Changing PMI-ACP Exam in 2015: What is New and What Has Changed? (Part – 1 and Part - 2)
- PMI-ACP Prep: Agile Scrum - Sprint I/O (Inputs and Outputs)
- PMI-ACP Prep: Scrum and Kanban – Similarities and Differences
- PMI-ACP Prep: Introduction to Kanban, Kanban System and Kanban Development
No comments:
Post a Comment
Sign- or Log-in and put your name while asking queries in comments. Any comment is welcome - comments, review or criticism. But off-topic, abusive, defamatory comments will be moderated or may be removed.